
[INFOGRAPHICS] February 2017 Fraser Valley Real Estate Stats
[INFOGRAPHICS] February 2017 Greater Vancouver Real Estate Stats
[VIDEO BLOG] January 2017 Fraser Valley Real Estate Stats
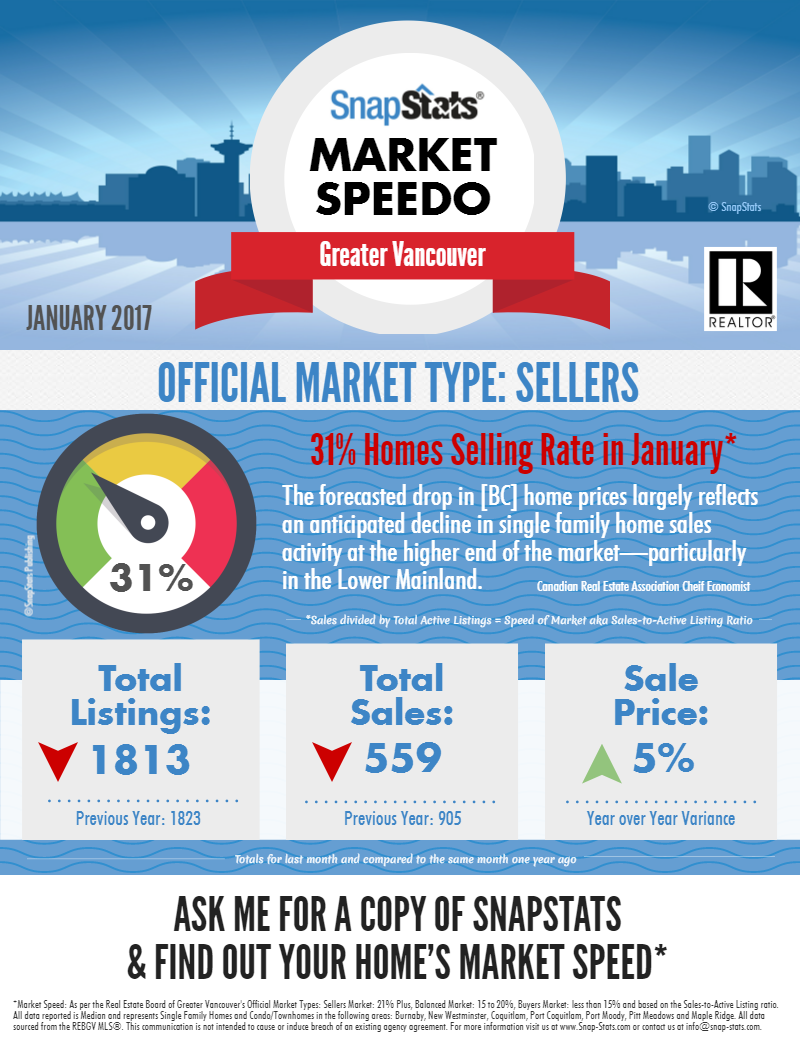
[VIDEO BLOG] January 2017 Greater Vancouver Real Estate Stats
[VIDEO BLOG] January 2017 Metro Vancouver Real Estate Stats
Video Blog- November 2016 Greater Vancouver Real Estate Stats
The latest batch of government statistics adds more evidence to suggest the 15% tax on foreign buyers is having a significant effect on the level of non-Canadian purchasers in the market.
The market speed for greater Vancouver is 34% which officially makes it a seller’s market.
Reasons why:
SALES– Total sales last month were 854, which is 34% less year over year & 2% less month over month.
SALES PRICE– The median sale price was $721,000 which is a 16% increase over this time last year and no change over the previous month.
FIND OUT YOUR MARKET SPEED– Learn the official market speed in your neighbourhood and price point by requesting a free greater Vancouver snap stats report from us!
ACTIVE LISTINGS– There were 2,479 active listings last month which is a 10% decrease over this time last year and a 2% decrease month over month.
DAYS ON THE MARKET– A property was on the market for 13 days before selling which is 28% less than one year ago and 13% less than the previous month.
{INFOGRAPHICS} November 2016 Metro Vancouver Real Estate Stats
Video Blog- November 2016 Metro Vancouver Real Estate Stats
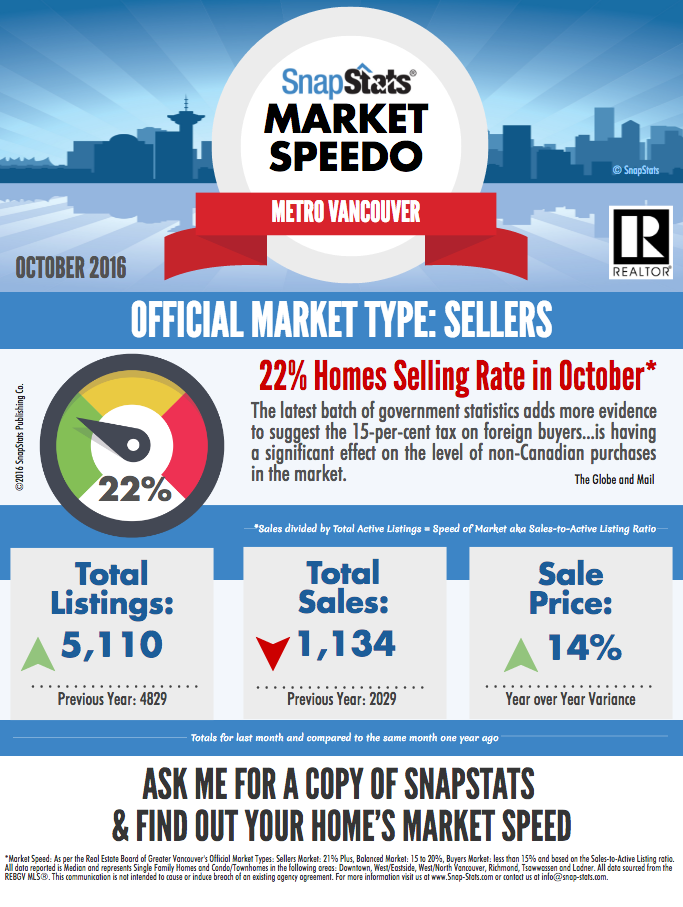
The latest batch of government statistics adds more evidence to suggest the 15% tax on foreign buyers is having a significant effect on the level of non-Canadian purchasers in the market.
The market speed for Metro Vancouver is 22% which officially makes it a seller’s market.
Reasons why:
SALES- Total sales last month were 1,134, which is 44% less year over year & 2% less month over month.
SALES PRICE- The median sale price was $1.21 million which is a 14% increase over this time last year and a 1% increase over the previous month.
FIND OUT YOUR MARKET SPEED– Learn the official market speed in your neighbourhood and price point by requesting a free Metro Vancouver snap stats report from us!
ACTIVE LISTINGS– There were 5,110 active listings last month which is a 6% increase over this time last year and a 1% increase month over month.
DAYS ON THE MARKET– A property was on the market for 19 days before selling which is 27% more than one year ago and 12% more than the previous month.
Video Blog- November 2016 Fraser Valley Real Estate Stats
The latest batch of government statistics adds more evidence to suggest the 15% tax on foreign buyers is having a significant effect on the level of non-Canadian purchasers in the market.
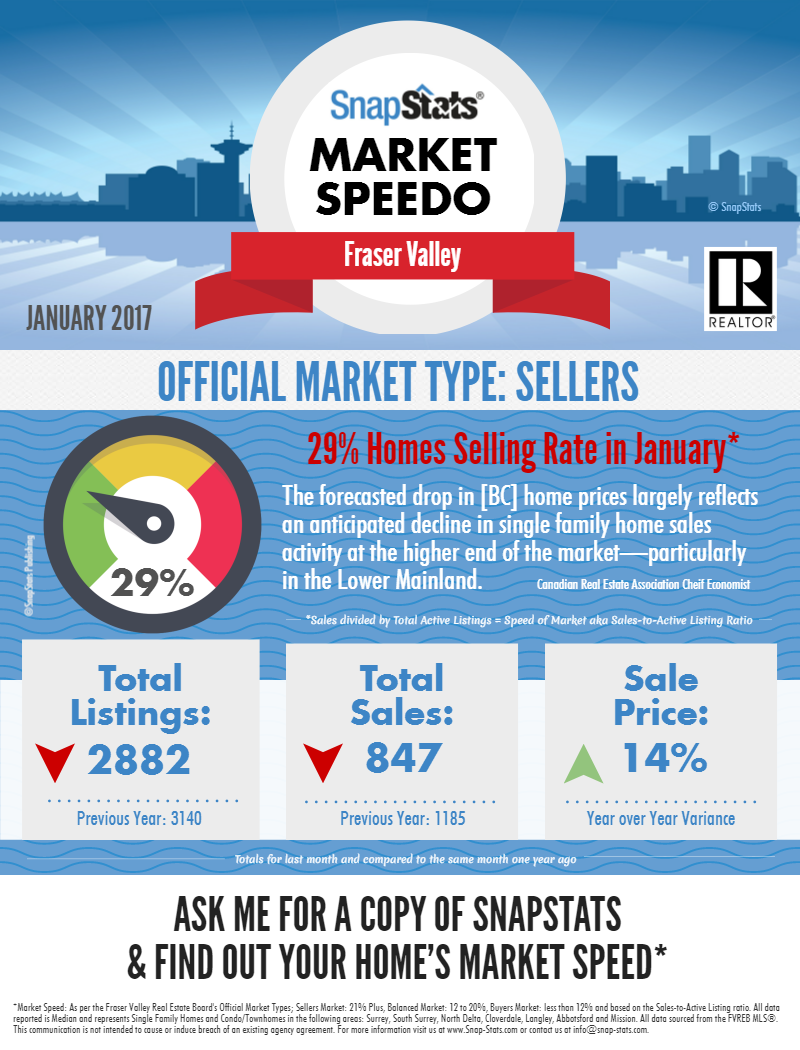
The market speed for The Fraser Valley is 32% which officially makes it a seller’s market.
Reasons why:
SALES- Total sales last month were 1,298, which is 16% less year over year & 12% greater month over month.
SALES PRICE- The median sale price was $585,000 which is a 19% increase over this time last year and a 1% decrease over the previous month.
FIND OUT YOUR MARKET SPEED– Learn the official market speed in your neighbourhood and price point by requesting a free Fraser Valley snap stats report from us!
ACTIVE LISTINGS– There were 4,093 active listings last month which is a 6% decrease over this time last year and an 8% decrease month over month.
DAYS ON THE MARKET– A property was on the market for 19 days before selling which is 14% less than one year ago and 19% more than the previous month.